Export value in June decreased by 2.5%, while import value grew by 0.7% in Latvia
2012-08-10 11:35:38
As compared to the previous month, export value in June 2012 decreased by 2.5%, while import value grew by 0.7%. The most significant drop was recorded in export of mineral products – of LVL 22.7 million or 37.5% and in export of base metals and articles of base metals – of LVL 9.8 million or 10.4%. In its turn, import growth was mostly affected by increase in import of transport vehicles – of LVL 7.3 million or 12.5%, in import of mineral products – of 6.4 million or 5.5% and in import of products of the chemical and allied industries – of LVL 6.1 million or 10.5%.
In January – June 2012, foreign trade turnover value reached LVL 7189.0 million – 13.5% or LVL 857.8 million more than in the corresponding period of the previous year. Of which exports comprised LVL 3113.8 million – an increase of 10.5% or LVL 295.3 million, whereas imports constituted LVL 4075.2 million – 16.0% or LVL 562.5 million more than a year ago.
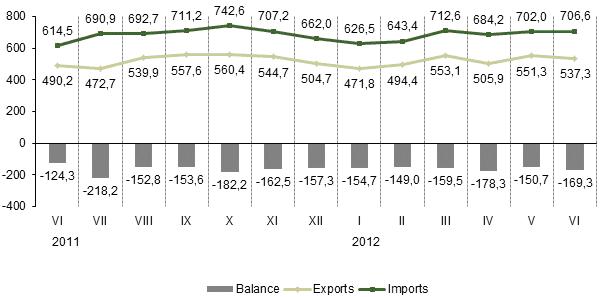 |
| Foreign trade of Latvia, million LVL (1) |
________________
1) Data on March 2012 have been revised.
Main commodities in Latvia’s foreign trade in June 2012, at current prices
|
|
Exports |
Imports |
Foreign trade balance, thousand LVL (+,-) |
|||||
|
thousand LVL |
% of total |
% (+, –) over 2011 June |
thousand LVL |
% of total |
% (+, –) over 2011 June |
|||
|
Total |
537 277 |
100 |
+9.6 |
706 566 |
100 |
+15.0 |
-169 289 |
|
|
Agricultural and food products (I-IV) |
91 156 |
17.0 |
+31.2 |
107 605 |
15.2 |
+14.9 |
-16 449 |
|
|
Live animals and animal products (I) |
25 497 |
4.7 |
+18.2 |
24 666 |
3.5 |
+13.3 |
+831 |
|
|
|
meat and offal (02) |
3 223 |
0.6 |
+19.9 |
8 568 |
1.2 |
+2.9 |
-5 345 |
|
|
fish (fresh, frozen, smoked) (03) |
7 081 |
1.3 |
+48.2 |
7 315 |
1.0 |
+20.2 |
-234 |
|
|
dairy produce, eggs (04) |
12 916 |
2.4 |
+7.0 |
7 151 |
1.0 |
+9.9 |
+5 765 |
|
Vegetation products (II) |
16 268 |
3.0 |
+43.1 |
25 429 |
3.6 |
+9.5 |
-9 161 |
|
|
|
edible fruit and nuts (08) |
3 485 |
0.6 |
+63.4 |
8 318 |
1.2 |
+14.4 |
-4 833 |
|
|
cereals (10) |
5 381 |
1.0 |
+15.5 |
3 398 |
0.5 |
-18.9 |
+1 983 |
|
|
oilseeds (12) |
2 023 |
0.4 |
+4.4 times |
1 587 |
0.2 |
-29.2 |
+436 |
|
Prepared foodstuffs (IV) |
48 005 |
8.9 |
+36.7 |
49 836 |
7.1 |
+12.8 |
-1 831 |
|
|
|
preparations of meat, or fish (16) |
5 598 |
1.0 |
+9.3 |
2 796 |
0.4 |
+6.4 |
+2 802 |
|
|
miscellaneous edible preparations (incl. coffee, tea, etc.)(21) |
1 745 |
0.3 |
+1.1 |
7 306 |
1.0 |
+22.1 |
-5 561 |
|
|
beverages, spirits and vinegar (22) |
28 004 |
5.2 |
+58.1 |
13 099 |
1.9 |
+1.9 |
+14 905 |
|
|
tobacco and manufactured tobacco substitutes (24) |
1 510 |
0.3 |
-13.5 |
3 651 |
0.5 |
+28.2 |
-2 141 |
|
Mineral products (V) 1) |
37 754 |
7.0 |
-28.5 |
122 288 |
17.3 |
+11.4 |
-84 534 |
|
|
|
mineral fuels, mineral oils and products of their distillation (27) |
33 326 |
6.2 |
-30.9 |
119 056 |
16.8 |
+11.1 |
-85 730 |
|
Products of the chemical and allied industries (VI) |
38 718 |
7.2 |
-8.6 |
63 975 |
9.1 |
+12.3 |
-25 257 |
|
|
|
pharmaceutical products (30) |
17 769 |
3.3 |
-13.3 |
23 783 |
3.4 |
-5.7 |
-6 014 |
|
Plastics and articles thereof; rubber and articles thereof (VII) |
18 047 |
3.4 |
+16.2 |
39 610 |
5.6 |
+8.5 |
-21 563 |
|
|
|
plastics and articles thereof (39) |
14 233 |
2.6 |
+15.3 |
30 407 |
4.3 |
+10.6 |
-16 174 |
|
Wood and articles of wood; wood charcoal; cork and articles of cork; manufactures of straw, of esparto or of other plaiting materials (IX) |
93 265 |
17.4 |
+8.3 |
10 841 |
1.5 |
+15.8 |
+82 424 |
|
|
|
wood and articles of wood; wood charcoal (44) |
93 221 |
17.4 |
+8.4 |
10 761 |
1.5 |
+15.7 |
+82 460 |
|
Pulp of wood or of other fibrous cellulosic material; paper and paperboard and articles thereof (X) |
11 987 |
2.2 |
+22.0 |
15 693 |
2.2 |
+2.7 |
-3 706 |
|
|
|
paper and paperboard; articles of paper pulp, of paper or of paperboard (48) |
6 418 |
1.2 |
+14.2 |
14 046 |
2.0 |
+1.6 |
-7 628 |
|
|
products of the printing industry; manuscripts (49) |
4 742 |
0.9 |
+31.6 |
1 561 |
0.2 |
+15.7 |
+3 181 |
|
Textiles and textile articles (XI) |
22 791 |
4.2 |
+23.1 |
27 781 |
3.9 |
+20.8 |
-4 990 |
|
|
|
knitted or crocheted fabrics (60) |
1 774 |
0.3 |
+50.4 |
1 874 |
0.3 |
+17.6 |
-100 |
|
|
articles of apparel and clothing accessories, knitted or crocheted (61) |
6 069 |
1.1 |
+13.2 |
5 308 |
0.8 |
+12.3 |
+761 |
|
|
articles of apparel and clothing accessories, not knitted or crocheted (62) |
8 158 |
1.5 |
+37.2 |
7 929 |
1.1 |
+43.7 |
+229 |
|
Base metals and articles of base metals (XV) |
83 979 |
15.6 |
+22.8 |
82 149 |
11.6 |
+18.4 |
+1 830 |
|
|
|
iron and steel (72) |
47 316 |
8.8 |
+36.2 |
45 957 |
6.5 |
+17.2 |
+1 359 |
|
|
articles of iron or steel (73) |
24 285 |
4.5 |
+39.9 |
22 185 |
3.1 |
+18.4 |
+2 100 |
|
Machinery and mechanical appliances; electrical equipment (XVI) |
71 770 |
13.4 |
+21.3 |
122 580 |
17.3 |
+22.8 |
-50 810 |
|
|
|
machinery and mechanical appliances (84) |
28 769 |
5.4 |
+2.3 |
67 710 |
9.6 |
+25.5 |
-38 941 |
|
|
electrical machinery and equipment (85) |
43 001 |
8.0 |
+38.5 |
54 871 |
7.8 |
+19.6 |
-11 870 |
|
Vehicles, aircraft, vessels and associated transport equipment (XVII) |
28 084 |
5.2 |
-17.8 |
65 370 |
9.3 |
+10.2 |
-37 286 |
|
|
|
vehicles other than railway or tramway rolling stock, and parts and accessories thereof (87) |
26 725 |
5.0 |
-12.8 |
50 484 |
7.1 |
-1.5 |
-23 759 |
|
Miscellaneous manufactured articles (XX) |
14 479 |
2.7 |
+18.0 |
17 604 |
2.5 |
+32.7 |
-3 125 |
|
|
|
furniture; bedding, mattresses, mattress supports, cushions and similar stuffed furnishings; lamps and lighting fittings (94) |
11 968 |
2.2 |
+22.5 |
10 515 |
1.5 |
+34.0 |
+1 453 |
|
Other goods |
25 247 |
4.7 |
+16.3 |
31 070 |
4.4 |
+10.3 |
-5 823 |
|
______________
¹) This group includes useful minerals, oil and oil products, natural gas and electricity.
In June 2012 the most significant share (69.7%) in Latvia’s export had export to the countries of the European Union, followed by export to the CIS countries – 15.6%. The main export partners were Lithuania (16.8% of the total export volume), Estonia (12.6%), Russia (11.4%), Germany (7.2%) and Sweden (5.6%).
In June 2012 the most significant share (78.2%) in Latvia’s import had import from the countries of the European Union, followed by import from the CIS countries – 15.3%. The main import partners were Lithuania (19.5% of the total import volume), Germany (11.2%), Poland (8.8%), Russia (7.7%) and Estonia (7.5%).